pprof CPU Profile
pprof, a profiling tool, can output callgraphs in Graphviz format.
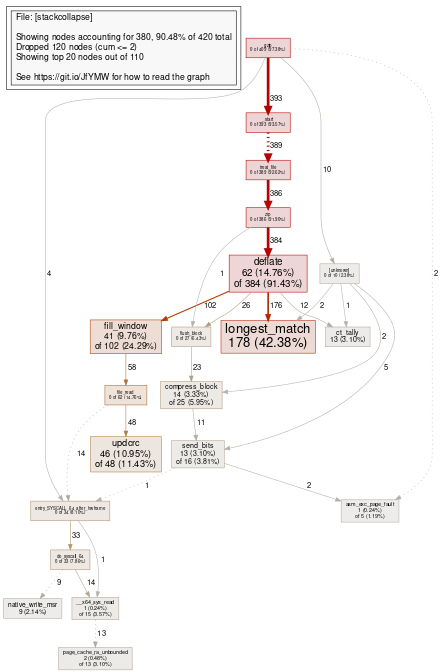
This is a CPU profile of the gzip program, limited to the top 20 stack frames, generated from a pprof.profile with:
$ go tool pprof --nodecount=20 --dot pprof.profile
This illustrates how to create a legend in Graphviz.
Node sizes, arrow sizes, and increasing redness all indicate the number of samples in that callstack.

[Input .gv File] [SVG] [Raster Image]
pprof.gv.txt
digraph "[stackcollapse]" {
fontname="Helvetica,Arial,sans-serif"
node [fontname="Helvetica,Arial,sans-serif"]
edge [fontname="Helvetica,Arial,sans-serif"]
node [style=filled fillcolor="#f8f8f8"]
subgraph cluster_L { "File: [stackcollapse]" [shape=box fontsize=16 label="File: [stackcollapse]\l\lShowing nodes accounting for 380, 90.48% of 420 total\lDropped 120 nodes (cum <= 2)\lShowing top 20 nodes out of 110\l\lSee https://git.io/JfYMW for how to read the graph\l" tooltip="[stackcollapse]"] }
N1 [label="deflate\n62 (14.76%)\nof 384 (91.43%)" id="node1" fontsize=18 shape=box tooltip="deflate (384)" color="#b20400" fillcolor="#edd6d5"]
N2 [label="gzip\n0 of 409 (97.38%)" id="node2" fontsize=8 shape=box tooltip="gzip (409)" color="#b20100" fillcolor="#edd5d5"]
N3 [label="longest_match\n178 (42.38%)" id="node3" fontsize=24 shape=box tooltip="longest_match (178)" color="#b22800" fillcolor="#eddad5"]
N4 [label="fill_window\n41 (9.76%)\nof 102 (24.29%)" id="node4" fontsize=16 shape=box tooltip="fill_window (102)" color="#b23d00" fillcolor="#edddd5"]
N5 [label="updcrc\n46 (10.95%)\nof 48 (11.43%)" id="node5" fontsize=17 shape=box tooltip="updcrc (48)" color="#b27d4c" fillcolor="#ede6df"]
N6 [label="file_read\n0 of 62 (14.76%)" id="node6" fontsize=8 shape=box tooltip="file_read (62)" color="#b2682e" fillcolor="#ede3db"]
N7 [label="entry_SYSCALL_64_after_hwframe\n0 of 34 (8.10%)" id="node7" fontsize=8 shape=box tooltip="entry_SYSCALL_64_after_hwframe (34)" color="#b2906a" fillcolor="#ede8e3"]
N8 [label="compress_block\n14 (3.33%)\nof 25 (5.95%)" id="node8" fontsize=13 shape=box tooltip="compress_block (25)" color="#b29b7d" fillcolor="#edeae6"]
N9 [label="send_bits\n13 (3.10%)\nof 16 (3.81%)" id="node9" fontsize=13 shape=box tooltip="send_bits (16)" color="#b2a590" fillcolor="#edebe8"]
N10 [label="ct_tally\n13 (3.10%)" id="node10" fontsize=13 shape=box tooltip="ct_tally (13)" color="#b2a896" fillcolor="#edebe9"]
N11 [label="do_syscall_64\n0 of 33 (7.86%)" id="node11" fontsize=8 shape=box tooltip="do_syscall_64 (33)" color="#b2916c" fillcolor="#ede8e3"]
N12 [label="_start\n0 of 393 (93.57%)" id="node12" fontsize=8 shape=box tooltip="_start (393)" color="#b20300" fillcolor="#edd5d5"]
N13 [label="zip\n0 of 386 (91.90%)" id="node13" fontsize=8 shape=box tooltip="zip (386)" color="#b20400" fillcolor="#edd6d5"]
N14 [label="native_write_msr\n9 (2.14%)" id="node14" fontsize=12 shape=box tooltip="native_write_msr (9)" color="#b2ac9f" fillcolor="#edecea"]
N15 [label="treat_file\n0 of 389 (92.62%)" id="node15" fontsize=8 shape=box tooltip="treat_file (389)" color="#b20400" fillcolor="#edd5d5"]
N16 [label="[unknown]\n0 of 10 (2.38%)" id="node16" fontsize=8 shape=box tooltip="[unknown] (10)" color="#b2ab9d" fillcolor="#edecea"]
N17 [label="page_cache_ra_unbounded\n2 (0.48%)\nof 13 (3.10%)" id="node17" fontsize=10 shape=box tooltip="page_cache_ra_unbounded (13)" color="#b2a896" fillcolor="#edebe9"]
N18 [label="asm_exc_page_fault\n1 (0.24%)\nof 5 (1.19%)" id="node18" fontsize=10 shape=box tooltip="asm_exc_page_fault (5)" color="#b2afa7" fillcolor="#edeceb"]
N19 [label="__x64_sys_read\n1 (0.24%)\nof 15 (3.57%)" id="node19" fontsize=10 shape=box tooltip="__x64_sys_read (15)" color="#b2a692" fillcolor="#edebe8"]
N20 [label="flush_block\n0 of 27 (6.43%)" id="node20" fontsize=8 shape=box tooltip="flush_block (27)" color="#b29979" fillcolor="#ede9e5"]
N2 -> N12 [label=" 393" weight=94 penwidth=5 color="#b20300" tooltip="gzip -> _start (393)" labeltooltip="gzip -> _start (393)"]
N12 -> N15 [label=" 389" weight=93 penwidth=5 color="#b20400" tooltip="_start ... treat_file (389)" labeltooltip="_start ... treat_file (389)" style="dotted"]
N15 -> N13 [label=" 386" weight=92 penwidth=5 color="#b20400" tooltip="treat_file -> zip (386)" labeltooltip="treat_file -> zip (386)"]
N13 -> N1 [label=" 384" weight=92 penwidth=5 color="#b20400" tooltip="zip -> deflate (384)" labeltooltip="zip -> deflate (384)"]
N1 -> N3 [label=" 176" weight=42 penwidth=3 color="#b22800" tooltip="deflate -> longest_match (176)" labeltooltip="deflate -> longest_match (176)"]
N1 -> N4 [label=" 102" weight=25 penwidth=2 color="#b23d00" tooltip="deflate -> fill_window (102)" labeltooltip="deflate -> fill_window (102)"]
N4 -> N6 [label=" 58" weight=14 color="#b26e37" tooltip="fill_window -> file_read (58)" labeltooltip="fill_window -> file_read (58)"]
N6 -> N5 [label=" 48" weight=12 color="#b27d4c" tooltip="file_read -> updcrc (48)" labeltooltip="file_read -> updcrc (48)"]
N7 -> N11 [label=" 33" weight=8 color="#b2916c" tooltip="entry_SYSCALL_64_after_hwframe -> do_syscall_64 (33)" labeltooltip="entry_SYSCALL_64_after_hwframe -> do_syscall_64 (33)"]
N1 -> N20 [label=" 26" weight=7 color="#b29a7b" tooltip="deflate -> flush_block (26)" labeltooltip="deflate -> flush_block (26)"]
N20 -> N8 [label=" 23" weight=6 color="#b29e81" tooltip="flush_block -> compress_block (23)" labeltooltip="flush_block -> compress_block (23)"]
N11 -> N19 [label=" 14" weight=4 color="#b2a794" tooltip="do_syscall_64 -> __x64_sys_read (14)" labeltooltip="do_syscall_64 -> __x64_sys_read (14)"]
N6 -> N7 [label=" 14" weight=4 color="#b2a794" tooltip="file_read ... entry_SYSCALL_64_after_hwframe (14)" labeltooltip="file_read ... entry_SYSCALL_64_after_hwframe (14)" style="dotted"]
N19 -> N17 [label=" 13" weight=4 color="#b2a896" tooltip="__x64_sys_read ... page_cache_ra_unbounded (13)" labeltooltip="__x64_sys_read ... page_cache_ra_unbounded (13)" style="dotted"]
N1 -> N10 [label=" 12" weight=3 color="#b2a999" tooltip="deflate -> ct_tally (12)" labeltooltip="deflate -> ct_tally (12)"]
N8 -> N9 [label=" 11" weight=3 color="#b2aa9b" tooltip="compress_block -> send_bits (11)" labeltooltip="compress_block -> send_bits (11)"]
N2 -> N16 [label=" 10" weight=3 color="#b2ab9d" tooltip="gzip -> [unknown] (10)" labeltooltip="gzip -> [unknown] (10)"]
N11 -> N14 [label=" 9" weight=3 color="#b2ac9f" tooltip="do_syscall_64 ... native_write_msr (9)" labeltooltip="do_syscall_64 ... native_write_msr (9)" style="dotted"]
N16 -> N9 [label=" 5" weight=2 color="#b2afa7" tooltip="[unknown] -> send_bits (5)" labeltooltip="[unknown] -> send_bits (5)"]
N2 -> N7 [label=" 4" color="#b2b0aa" tooltip="gzip -> entry_SYSCALL_64_after_hwframe (4)" labeltooltip="gzip -> entry_SYSCALL_64_after_hwframe (4)"]
N16 -> N8 [label=" 2" color="#b2b1ae" tooltip="[unknown] -> compress_block (2)" labeltooltip="[unknown] -> compress_block (2)"]
N16 -> N3 [label=" 2" color="#b2b1ae" tooltip="[unknown] -> longest_match (2)" labeltooltip="[unknown] -> longest_match (2)"]
N2 -> N18 [label=" 2" color="#b2b1ae" tooltip="gzip ... asm_exc_page_fault (2)" labeltooltip="gzip ... asm_exc_page_fault (2)" style="dotted"]
N9 -> N18 [label=" 2" color="#b2b1ae" tooltip="send_bits -> asm_exc_page_fault (2)" labeltooltip="send_bits -> asm_exc_page_fault (2)"]
N16 -> N10 [label=" 1" color="#b2b2b0" tooltip="[unknown] -> ct_tally (1)" labeltooltip="[unknown] -> ct_tally (1)"]
N7 -> N19 [label=" 1" color="#b2b2b0" tooltip="entry_SYSCALL_64_after_hwframe -> __x64_sys_read (1)" labeltooltip="entry_SYSCALL_64_after_hwframe -> __x64_sys_read (1)"]
N9 -> N7 [label=" 1" color="#b2b2b0" tooltip="send_bits ... entry_SYSCALL_64_after_hwframe (1)" labeltooltip="send_bits ... entry_SYSCALL_64_after_hwframe (1)" style="dotted"]
N13 -> N20 [label=" 1" color="#b2b2b0" tooltip="zip -> flush_block (1)" labeltooltip="zip -> flush_block (1)"]
}